How to Use Regression Analysis to Plan Strategies and Achieve Goals
Want to understand why your business produces certain results? For example, why advertising works well or poorly, why customers leave, or how much money you can earn in the future? Regression analysis can help.
Regression analysis is a strong statistical method that allows you to uncover the relationship between variables. In simple words, it shows how one variable affects another (for example, revenue or customer retention) based on ad spend or customer support wait times.
With this analysis method, you're able to make more informed data-driven decisions – so you don't have to rely on gut instinct.
In this article, we walk through the main questions: What is regression analysis, when and where you should use it, and how it can help you plan more profitable business strategies.
You'll also be able to see real examples, calculations, and application scenarios from marketing, product, finance, and research teams.
What is a regression analysis?
It's a statistical technique used to examine the relationship between 2 or more variables. It helps you understand how the changes in one variable (termed the independent variable) affect another variable (termed the dependent variable).
For example, you might want to determine the impact of your monthly advertising expenditure (independent variable) on your new customer number (dependent variable). With regression analysis, you can measure such a relationship between variables and predict future outcomes.
To define regression analysis, it helps to understand how it answers questions such as:
- "If I increase X, what happens to Y?"
- "What's driving our performance the most?"
- "Can current data tell us what will happen next?"
What does a regression analysis tell you?
The importance of regression analysis lies in that it tells you fact-based answers to crucial business questions. Below you can see some examples:
- Direction of the relationship: Is it positive (both variables rise together) or negative (When one rises, the other falls)?
- Strength of the relationship: How highly correlated are the variables? (When ad spending goes up and revenue increases too, it means the two variables are positively correlated.)
- Impact: How much of a change in the dependent variable is caused by a change in the independent variable? (For example, if +$100 in advertising brings +$500 in revenue, that's a big impact.)
- Predictability: How well can you use this model to forecast future events? (For example, is it possible to predict next month's sales based on current marketing spending?)
If you do a regression analysis of marketing cost (X) against sales revenue (Y), the analysis output could be:
- Marketing expenses and revenue show a very high positive correlation.
- For every additional $1,000 of marketing expense, revenue is $4,500.
- Your regression model explains 80% of the variation in sales, meaning it's a good predictor.
Information like this is priceless when making planning and budgeting decisions, which answers the question: why do we use regression analysis?
When to use regression analysis as a business
Regression analysis can assist teams throughout your business in making smarter and more forward-looking decisions. So, what is regression analysis used for? You can apply it when you need to:
- Understand what's affecting performance
- Spot patterns or trends over time
- Make more reliable predictions based on data
- Assess the success of a campaign or initiative
- Make decisions based on facts, not guesswork
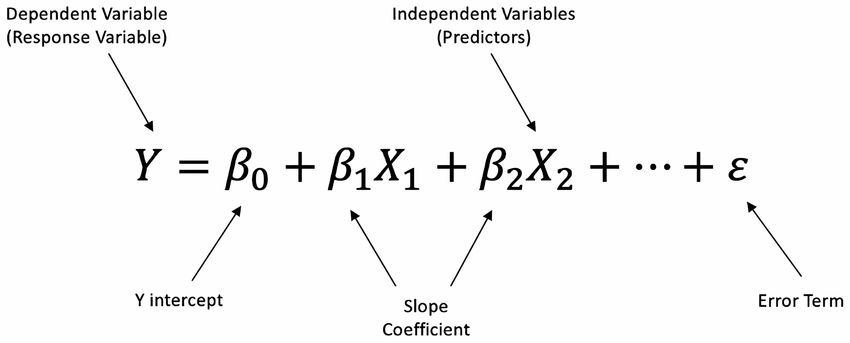
Regression analysis is based on a formula like this one published on ResearchGate:
Uses of regression analysis across business teams
So, which teams actually use regression analysis, and what for?
Market research
The answer to the question "What is regression analysis in research?" is a multifaceted one, as the method can be used across all research disciplines.
In market research, it's usually used to understand the impact of different external and internal factors on a business's performance. For example:
- How much does ad spend improve sales numbers?
- How does price influence purchase intent?
- Does customer satisfaction score predict the likelihood a customer is to recommend your product?
This information is then shared with the other teams in the business to make decisions.
Marketing
A marketing team wants to understand how marketing spend influences customer acquisition.
They can use regression analysis to compare Customer Acquisition Cost (CAC) and Customer Lifetime Value (LTV) over time versus spend across different channels.
Suppose you collect this data over 4 months:
In this instance, regression analysis helps to determine if increased marketing spend is driving CAC lower (good) and LTV higher (good too). This research enables the team to identify the spend level that creates the widest gap between LTV and CAC.
Customer support
Let's imagine that a customer support team wants to analyze how unresolved tickets affect customer churn. The team examines the relationship between the number of open tickets and the churn rate on a monthly basis.
Regression can indicate, for example, that when there are over 50 open tickets, churn increases by 20%, so the team knows to prioritize fixing SLAs (Service Level Agreements) and resource planning.
Product management
The product team wants to know: How does product usage change with seasonality?
They can analyze seasons (months) in terms of feature rollouts or sales volumes and determine when to add new features or run promotions.
Finance
Wondering when to use a regression analysis in finance? Let's imagine the important question is: What drives revenues in the long term?
The finance team can create a multiple regression model, using financial services industry survey solutions, to determine how the number of reps for sale, the size of the deal, and other market conditions affect monthly revenue.
This awareness can help in headcount planning, decision-making, and pricing strategy.
How to conduct regression analysis
To fully answer the question, "what does regression analysis do?" let's walk through the steps to run it correctly:
1. Write down your question or aim
Start with a clear idea of what you want to find out. For example: "Does increasing customer support staff reduce customer churn?"
Your main goal will guide everything, from the data you collect to the kind of regression model you employ.
2. Identify your variables
- Independent variable(s) – the factor(s) you believe influence the outcome (for example, support staff number).
- Dependent variable – the outcome you wish to measure (for example, churn rate).
3. Collect and prepare your data
Get historical data for your independent and dependent variables. Make sure the data is clean and accurate, consistent over time, and complete (fill in or remove missing values).
You can organize your data with tools like Excel, Google Sheets, R, Python (Pandas), or BI tools.
4. Select the appropriate type of regression
If you're predicting a continuous variable (like revenue), then use linear or multiple regression. If the outcome is a yes/no (like churned or not churned), then use logistic regression. We'll detail the types in the next section.
5. Run the regression
Use a package like Excel, R, Python (statsmodels or scikit-learn), or a data platform (SPSS, SAS, or Tableau). Most packages require you to enter your variables and select your type of regression. The program will then perform the calculations automatically.
6. Interpret the results
When you get your regression analysis results, here are the key terms to look at:
7. Act on the insights
Implement what you have learned:
- Adjust budgets
- Allocate resources differently
- Plan campaigns
- Deploy new features
- Forecast revenue
The actual strength of regression is converting data into decisions.
Checkbox helps you collect data for regression analysis. Request a demo!
The most common types of regression analysis
Different types of regression models are suited for diverse types of data and queries.
Linear regression
It's the most basic and most popular type. It illustrates the relationship between one independent variable and one dependent variable, and it makes a straight-line (linear) relationship assumption.
In the chapter 'When to use regression analysis as a business' above, we were shown exactly this kind of formula for linear regression. Use this formula when you need to predict a continuous outcome (sales, revenue, hours worked).
Example: Predict monthly sales based on advertising spending.
Multiple linear regression
This is a generalization of linear regression analysis in statistics (or research) with two or more independent variables to predict a single outcome. Use it when you must measure the effect of several factors at once.
Example: Predicts revenue for a month given advertising spend, number of sales reps, and deal size.
Formula: Y = b₀ + b₁X₁ + b₂X₂ + b₃X₃ +. + ε
Linear regression has a quite simple equation that is easy to understand. Other types of regression use more complex math and special functions, so their equations are harder to summarize – that's why we're focusing our discussion on linear regression in this article.
Logistic regression
Logistic regression doesn't predict a specific number like linear regression, but rather provides the probability of an event occurring. You can apply this formula when your output is binary (churned or did not churn, clicked or didn't click).
Example: The model predicts that a customer will churn with a probability of 0.82 (82%). If the threshold is 0.5, the model classifies: "Yes, they will churn."
Polynomial regression
Apply this type of analysis when your variables' pattern is curved, not linear. This means that when alterations in your input don't lead to constant increases/decreases in the outcome.
For instance, increasing the price can increase sales to a point, but after that, sales fall. A simple straight-line model (linear regression) can't chart this curvy pattern, but polynomial regression can.
Example: You would like to understand how price affects sales. At very low prices, you might not be making a profit. At very high prices, less is purchased. So the optimal sales are somewhere in the middle, and polynomial regression helps model this nonlinear relationship.
Poisson regression
This regression is used when your outcome is count data. So you're measuring how often something happens.
Use it when you're attempting to predict such things as tickets, errors, purchases, or logins.
Example: Predicts the number of support tickets opened per day given active users.
Cox regression (proportional hazards model)
This is used in survival analysis, which models the time until an event happens (like churn or failure). Use it when you want to understand what factors influence the time until something occurs.
Example: Estimates how product usage impacts the time until a user cancels their subscription.
Ordinal regression
This type is used where the outcome variable is of an ordinal nature, when responses or outcomes are in a natural order, but the difference between them is not necessarily equal. An example would be levels of satisfaction, such as "Low," "Medium," and "High," or survey scores from 1 through 5.
As opposed to logistic regression (which predicts yes/no values) or linear regression (predicting continuous values), ordinal regression is specifically employed to handle these ranked but not quantified outcomes.
There are several variants of ordinal regression models, of which the most conventional one is ordinal logistic regression. Others (for example, ordinal probit regression) exist but are less common.
Example: Respondents rate their mood as "Bad," "Okay," or "Good." Ordinal regression helps predict these ratings because they have order but aren't exact numbers.
How to use surveys to conduct regression analysis
Good surveys provide structured data. They are an excellent source to use for statistical regression analysis. No matter what you're collecting customer, employee, or market research data, surveys can help you find patterns, relationships, and predictors that matter.
Robust enterprise survey software simplifies the process of collecting, organizing, and preparing data for analysis.
Let's consider how you can use surveys for regression analysis:
Design surveys with regression in mind
- To apply survey data to regression, create measurable, uniform questions.
- Use numerical scales (e.g., 1–5 satisfaction rating)
- Add yes/no questions for binary answers
- Ask about specific behavior, attitude, or demographics that may have an impact on your outcome
Examples:
- "Would you recommend our product? (Scale: 1–10)"
- "Did you renew your subscription this month? (Yes/No?)"
- "What price are you willing to pay for this product? (Scale of prices)"
Define your variables
The dependent variable may be customer satisfaction, likelihood to recommend, renewal/cancellation (churn), or purchasing behavior.
Independent variables may include age, location, income (demographics), number of support requests, frequency of product use, responses to surveys about product features, and other factors.
Clean and code your data
Responses to customer surveys will be in categories or text, so you need to code them into numbers to apply them in regression analysis.
Example: Number satisfaction scale answers ("Very satisfied" = 5, "Neutral" = 3)
Also, clean the data: remove duplicates, handle missing responses, and make sure all formats are consistent (e.g., date formats, text casing, number formats).
Run regression analysis
Once you have cleaned and prepared your data, you can run different types of regression depending on your target variable:
1. Linear regression (for predicting numeric targets)
Use when your target variable is continuous (for example, satisfaction rating, Net Promoter Score, revenue).
Example: Is support satisfaction (rated 1–5) related to overall satisfaction (rated 1–10)?
2. Logistic regression (For binary targets (yes/no)
Apply when your target variable has just two categories.
Example: Does satisfaction rating predict if a customer will renew their subscription?
3. Ordinal regression (for ordered categories)
This type of regression will work best when the outcome variable is categorical but ordered.
Example: Predicting the level of satisfaction (low, medium, high) based on product usage experience.
Survey analysis example
Let's consider the example of survey analysis that provides actionable insights for businesses (such as retail brands, SaaS companies, subscription services) aiming to improve customer satisfaction and loyalty.
Goal: Find out what drives changes in Net Promoter Score (NPS).
Survey questions:
- "On a scale of 1–10, how likely are you to recommend us?" (NPS, dependent variable)
- "Rate our customer support" (1–5)
- "Rate ease of use" (1–5)
- "How many times did you contact support this month?" (numeric)
With a market research platform, you can collect and analyze large-scale survey data more easily and understand what drives major metrics.
Analysis: Run a multiple linear regression, with NPS as the dependent variable, and the other three questions as independent variables.
Results: The regression shows ease of use has the greatest positive impact on NPS.
Actionable insight: Now, you understand that improving user experience (UX) will help you boost customer loyalty.
Using Checkbox to analyze survey data
There are many analytics and reporting tools, including Checkbox, available for collecting and preprocessing survey data. Using Checkbox, you can:
- Collect structured data from questionnaires with a dynamic structure
- Export data in analysis-ready formats (CSV, Excel)
- Integrate easily with analytics software to conduct regression analysis
With Checkbox, your data will be analysis-ready in a shorter time, so you can focus on deriving insights.
How to use regression analysis to get results
Once you've built and interpreted your regression model, the next step is to turn what you've learned into action. Below are the main advantages of regression analysis applications.
Drive data-informed decisions
Regression analysis gives you confidence to act on facts, not just assumptions.
Example:
What the data's showing: A regression model shows that the addition of support staff reduces churn.
What you can do: Based on this, you can present a case for hiring two new agents based on the ROI (return on investment) estimate.
Optimize business processes
Use your insights to optimize business operations and processes for better outcomes.
Example:
What the data's showing: Marketing regression shows decreasing returns after $12,000/month ad spend.
What you can do: Set a spending limit on a channel where performance has stopped growing and redistribute the budget to other channels.
Forecast outcomes
The use of regression analysis will help you obtain more reliable predictions of future trends.
Example:
What the data's showing: Finance builds a model using product usage, churn rate, and pricing to predict monthly recurring revenue (MRR) 3 months in the future.
What you can do: Do more proactive planning, rather than wasting time trying to figure things out.
Demonstrate impact and ROI
Regression analysis allows you to quantify the impact of changes. It's essential when demonstrating results to stakeholders.
Example:
What the data's showing: Your product team releases a new feature. Regression shows that feature adoption predicts higher NPS scores.
What you can do: You show direct ROI from that release.
Reveal hidden insights
Regression occasionally exposes relationships you weren't expecting. This enables you to discover hidden opportunities or risks.
Example:
What the data's showing: You discover that users who've read your help documentation are more likely to renew.
What you can do: You invest in better documentation to improve retention.
Final thoughts
What does regression analysis show? This strategic tool reveals relationships between variables, helps businesses make smarter decisions, predicts future trends, and unlocks growth.
The purpose of regression analysis is to empower business teams to forecast outcomes with confidence, optimize resources and processes, improve customer satisfaction and retention, and more.
Start simple: choose one area of your business, gather relevant data, and apply regression to test a hypothesis. From there, build predictive models that guide real improvements.
And if you're using modern and powerful platforms like Checkbox for surveys and feedback, you're already one step closer to applying regression effectively. Request a demo today!
Regression analysis FAQs


Contact us
Fill out this form and our team will respond to connect.
If you are a current Checkbox customer in need of support, please email us at support@checkbox.com for assistance.
