CSAT score: how to measure customer satisfaction and improve it
A customer says "thanks" on a support call, but do they still feel confident in your product or service? Your onboarding process ends, but did new customers actually reach time-to-first-value? A delivery arrives, but did it match customer expectations?
That's where a CSAT score comes in. Used well, it gives you a simple, repeatable way to measure satisfaction at key moments in the customer journey – then turn that signal into better support outcomes, fewer customer churn risks, clearer product priorities, and a tighter feedback loop across teams.
In this article, we'll cover:
- What a CSAT score is and when it's most useful
- How to calculate your CSAT score
- What a good CSAT score looks like, plus how to find your average CSAT score
- How to run CSAT surveys that produce reliable customer feedback
- What to do with CSAT results – and how to improve your CSAT score over time
What is a CSAT score?
A CSAT score, short for customer satisfaction score, is a post-interaction metric that captures how satisfied someone is with a specific experience – e.g., a customer service interaction, a purchase delivery, an onboarding step, or a feature adoption moment.
Most teams collect it with a one-question customer satisfaction survey right after the event, then report results as either:
- A percentage of satisfied customers – Most common for dashboards and key performance indicators
- An average rating – Useful, but easy to misread unless it's labeled clearly
You'll also see CSAT labeled as a fast pulse-check on how customers feel about a specific interaction.
When CSAT is most useful
CSAT shines when you want insight into what the customer experience is at an exact point in time, while the experience is still fresh. That immediacy matters because memory fades fast, and later opinions get influenced by unrelated customer interactions.
Common high-value use cases include:
- Support ticket resolution – Did your customer support team actually solve the issue or just close the ticket?
- Onboarding milestones – Are new customers reaching first value or quietly stalling?
- Feature adoption – Did a new workflow make life easier or add confusion?
- Purchase and delivery – Was the product delivered on time and as expected?
In other words, CSAT is best at measuring satisfaction for a moment, not your entire relationship.
CSAT vs. NPS vs. CES – a quick comparison
CSAT, NPS, and CES are three customer satisfaction metrics that are related but don't answer the same question.
Here's a quick comparison to show what each is used for:
CSAT:
- Measures satisfaction with a specific interaction
- Used for support, onboarding, delivery, and key moments
NPS (net promoter score):
- Measures the likelihood to recommend and customer loyalty
- Used for brand loyalty and long-term customer sentiment
CES (customer effort score):
- Measures how much effort it took to get something done
- Used for journeys with friction: e.g., onboarding, logins, returns, and learning new features
A simple way to think about it: CSAT tells you how satisfied customers were, CES tells you how challenging or simple a product interaction was, and net promoter score tells you what they might tell their friends.
Common CSAT score ranges
A CSAT survey is typically scored on a 5-point or 10-point scale. The scale itself matters less than how you define "satisfied" and how consistently you measure it over time.
Two common approaches you'll see:
- Top box – Only the highest rating counts as satisfied (e.g., 5 on a 5-point scale)
- Top two box – The top two ratings count as satisfied (e.g., 4–5 on a 5-point scale)
On a 10-point scale, top two box is usually 9–10, while some teams use 8–10 depending on how tough they want the standard to be.
Consistency beats perfection, so pick a scale and definition you can stick with. Trend data is where CSAT becomes genuinely useful.
Choosing a scale that fits the channel
Match the scale to the context and the attention span of the moment:
- In-app and chat – A 5-point CSAT questionnaire is often enough. It's quick, it's mobile-friendly, and it keeps survey fatigue low.
- Email – You can support a slightly richer scale if your audience expects it, especially for longer touchpoints like onboarding or training.
- Phone follow-up – Keep it simple. The goal is a clean signal, not a research project.
Whatever scale you choose, keep your language labels consistent from end to end – for example, "Very dissatisfied" through to "Very satisfied." That small detail reduces confusion and improves response quality.
Define what counts as "satisfied" before you launch
Before you send your first customer survey, write down your definition in plain English.
For a 5-point scale, the most common definition is:
Satisfied customers = 4 or 5
That choice affects everything: reporting, targets, and how teams interpret progress. If one dashboard uses "average rating" and another uses "percent satisfied," you'll end up debating numbers instead of fixing the customer experience (CX).
How to calculate CSAT score
The most widely used method is the percentage of customers who selected your "satisfied" ratings, divided by total survey responses.
The standard CSAT formula (top two box)
For a 5-point scale where 4 and 5 count as satisfied:
CSAT (%) = (Responses of 4–5 ÷ Total responses) × 100
This is the classic CSAT metric you'll see tied to key performance indicators for customer support and service teams.
A simple example
Let's say you collect 100 survey responses after ticket closure:
- 80 customers select 4 or 5
- 20 customers select 1, 2, or 3
Your CSAT score is:
(80 ÷ 100) × 100 = 80%
That 80% is easy to track over time, compare across customer interactions, and segment by queue, region, or plan tier.
A common reporting mistake to avoid
Don't mix these two measures in the same dashboard without clear labels:
- Average rating (e.g., 4.2 out of 5)
- Percent satisfied (e.g., 84% CSAT)
They answer different questions. An average can hide polarization (lots of 5s and lots of 1s), while percent satisfied can hide shifts inside the lower ratings. If you need both, show both – and name them explicitly.
What is a good CSAT score?
Most teams want a single number: a good CSAT score they can aim for.
A practical rule of thumb for percent satisfied is:
- 75–85% often reads as "healthy"
- 90%+ is often "excellent"
Now the important caveat: "good" depends on your industry, touchpoint, audience, and channel. A post-delivery CSAT might naturally run higher than a technical troubleshooting CSAT. A high-friction enterprise workflow will usually score differently from a simple B2C checkout.
If you want a reality check on overall satisfaction levels, independent benchmarks can help you sanity-check targets. For example, the UK Customer Satisfaction Index (UKCSI) reported an all-sector score of 77.3 out of 100 in July 2025, and the American Customer Satisfaction Index (ACSI) reported U.S. overall customer satisfaction in the high 70s (e.g., 77.3 in Q4 2024 and 76.9 in Q2 2025, on a 0–100 scale).
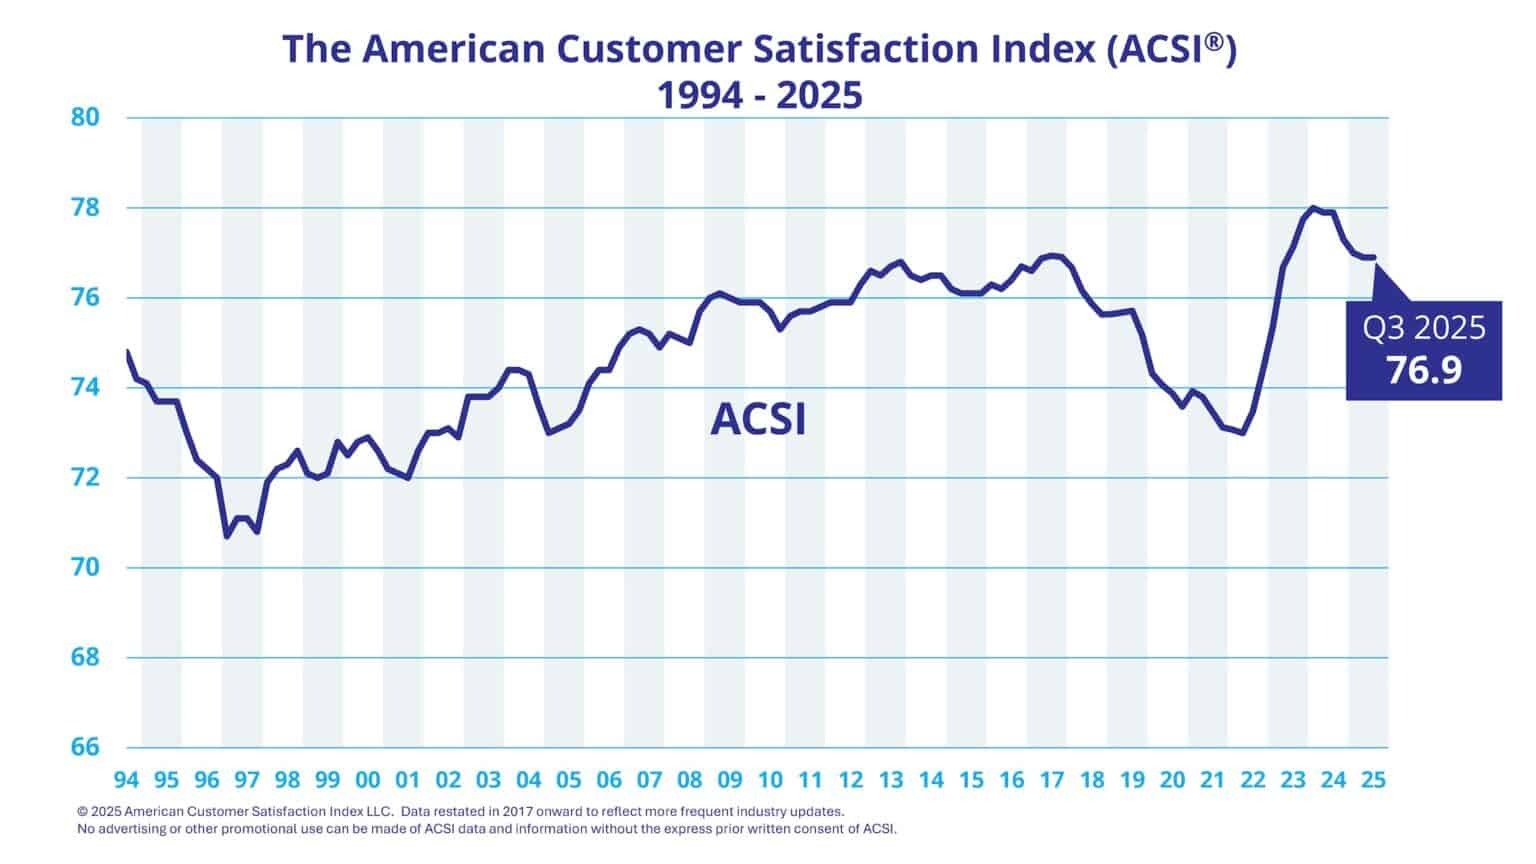
Even within a single industry, scores can vary by context. In ACSI's restaurant study, full-service restaurants scored in the low-to-mid 80s on a 0–100 scale – higher than many categories – showing how strong execution at the moment of service can lift overall satisfaction.
So what should you do with that?
- Start with a baseline from your own CSAT data
- Segment it by touchpoint
- Improve response rate and customer data hygiene
- Set targets that reflect what your customers actually experience, not what a generic internet benchmark says you "should" hit
Finding your average CSAT score
"Average CSAT score" sounds straightforward, but averages get messy fast.
Different measurement methods, different survey triggers, and different customer satisfaction levels across touchpoints can all skew the numbers. Even the scale matters: a 0–100 index score (like UKCSI or ACSI) isn't the same thing as percent satisfied from a CSAT survey – even if they're both used to describe overall customer satisfaction.
Instead of chasing a single magic number, build an "average" that's meaningful for your business goals.
Here's a simple approach to take:
- Pick your core touchpoints – support, onboarding, delivery, renewals, and key product areas
- Define your CSAT calculation for each (top box or top two box)
- Track each touchpoint separately for at least a few weeks
- Create an overall satisfaction roll-up only after you trust the underlying segments
That roll-up can be a weighted average based on volume (e.g., ticket count per queue), so one small workflow doesn't distort the whole picture.
What to compare your CSAT score against in priority order
When you're trying to interpret CSAT responses, compare in this order:
- Your historical trend – Week over week, month over month
- Channel and touchpoint averages – Chat vs. email, onboarding vs. support, self-serve vs. assisted
- Industry benchmarks, but only if they're methodologically similar
- Competitor signals – Reviews and public sentiment, treated carefully
Benchmarks can provide useful context, but the trend is what tells you whether you're actually improving customer experience.
Here are 2025's U.S. CSAT industry benchmarks, as shown in the ACSI's latest data:
Segment your average
Segmentation turns CSAT data from interesting insights into actionable ones. Useful cuts include:
- Support queue (billing, technical, onboarding, enterprise)
- Product area (feature set or workflow)
- Customer plan tier (self-serve vs. premium)
- Region and language (localization issues show up fast)
- Lifecycle stage (new vs. mature customers)
This is where you start to see patterns, for instance, that customers are happy overall, but unhappy customers in one queue are driving churn risk.
Set targets that drive action
Targets work best when they're tied to operational changes, not wishful thinking.
For example:
- "Raise onboarding CSAT by 5 points by reducing time-to-first-value."
- "Improve customer service interaction CSAT by tightening first response time during peak hours."
- "Reduce customer churn by improving renewal touchpoint CSAT for at-risk accounts."
These targets give teams something concrete to change, measure, and learn from.
How to run CSAT surveys that get reliable data
A CSAT score is only as trustworthy as the survey design behind it. If you want reliable customer insights, keep the mechanics simple and repeatable.
Here's a tactical checklist that works across most customer satisfaction surveys:
- Keep it short – one question is the core, with one optional follow-up if needed
- Send it fast – right after the event, while customers feel it clearly
- Define the trigger – don't rely on manual sends or inconsistent rules
- Control fatigue – cap how often a single customer receives feedback surveys
- Make it easy – one click, mobile-friendly, minimal friction
Timing and triggers
Good triggers map to real moments in the customer lifecycle:
- After ticket closure
- After an onboarding milestone
- After purchase delivery
- After help center use (especially self-serve resolution)
If your customers need to use multiple channels to get something done, effort creeps up and satisfaction drops. UKCSI reported that 26% of customers needed more than one channel to achieve their objective when interacting with an organization – a reminder that journeys often sprawl unless you design them carefully.
Question wording and templates
Your wording should match the touchpoint. These CSAT survey questions are widely used and easy to benchmark internally:
- "How satisfied are you with your experience today?"
- "How satisfied are you with the support you received?"
- "How satisfied are you with the resolution of your issue?"
If you want one extra layer without bloating the survey, add a single optional prompt for context – especially for neutral or negative experience ratings.
How to boost response quality
A few small details make a big difference to customer satisfaction survey response quality:
- One click wherever possible, especially on mobile
- Limit sends per customer to avoid tuning out
- Localize language and labels for region-specific clarity
- Use consistent scales so trendlines stay clean
- Route follow-ups so customers see that action happens
When customers believe feedback disappears into a spreadsheet, response rates decline, and customer sentiment gets noisier.
What to do with your CSAT results
A CSAT score isn't the finish line; it's a signal.
The real value comes from what you do next: closing the loop, spotting patterns across customer interactions, and prioritizing fixes that reduce friction.
Close the feedback loop
A simple, repeatable workflow looks like this:
- Alert on low scores as soon as possible
- Follow up quickly with the customer when it's appropriate
- Tag themes, such as delivery issue, usability, resolution quality, tone, and handoffs
- Assign owners across product, support, and ops
- Confirm resolution and capture what changed
This is where CSAT shifts from a metric to a system for reducing customer churn and protecting customer loyalty.
Pair the score with the "why?"
Numbers tell you what happened. An optional open-text or open-ended question tells you why.
A practical approach:
- Ask for context only on neutral or low ratings
- Keep it optional and lightweight
- Categorize themes so you can analyze at scale
Over time, those notes become a goldmine of customer feedback that helps you prioritize product fixes, improve the sales process handoff, and spot repeated friction across the customer journey.
If you need deeper exploration, CSAT can also help you recruit for qualitative work like focus groups – for example, inviting customers who gave a "3" to share what would have made it a "5."
How to improve your CSAT score
Improving CSAT is mostly about removing friction at the moments that matter, then making it easier for customers to succeed.
Here are targeted strategies that consistently move the needle:
- Reduce effort first – If customers have to repeat themselves, switch channels, or navigate complex security steps, satisfaction drops. Track CSAT alongside customer effort score to see when "how much effort" is the real problem.
- Tighten ownership – Customers don't care which team owns the issue. They care that someone owns it.
- Improve first-contact resolution – Even when the final answer is correct, slow back-and-forth can turn happy customers into frustrated ones.
- Set expectations early – Clear timelines, next steps, and realistic outcomes reduce negative surprises.
- Coach for clarity and tone – Your customer service team can be technically right and still leave customers feeling dismissed.
- Fix the same problem once – If the same theme appears in CSAT feedback every week, it's not a support issue anymore; it's a product or process issue.
- Close the loop visibly – Let customers know what changed because of their feedback, as this builds trust, drives positive responses, and can lift brand loyalty over time.
One more thing that's easy to miss: segment improvements.
A single overall CSAT number can hide the fact that one queue, one region, or one plan tier is dragging down overall satisfaction. Fix the bottleneck and your headline score will follow.
How Checkbox helps teams measure and improve CSAT
If you want CSAT to become an operational habit – not a one-off reporting exercise – you need a system that's easy to deploy, easy to automate, and easy to act on.
Checkbox is built to help teams run customer surveys across touchpoints, keep data secure, and turn CSAT data into workflows that people actually use.
Automate collection across touchpoints
Checkbox supports multi-channel distribution, so you can meet customers where they are:
- Email invitations and campaigns
- SMS/text distribution, including on-premises licensing support
- Links, embeds, and share options to fit web and app flows
- Branded surveys so the experience feels like your company, not a third-party tool
That flexibility makes it easier to trigger CSAT surveys right after the specific interaction you care about – which is where the most accurate satisfaction signal lives.
Turn responses into action with workflows and integrations
CSAT shouldn't get stuck in spreadsheets.
Checkbox supports integrations through webhooks, a REST API, and Zapier, so you can push CSAT responses into the systems your teams already rely on – CRM, support tools, data warehouses, or internal dashboards.
You can also automate follow-ups with actions like triggered emails, which help close the feedback loop while the moment is still fresh.
Reporting that supports trend tracking
To improve customer satisfaction over time, you need visibility that's fast and easy to segment.
Checkbox supports reporting dashboards and custom reports, which makes it simpler to track trendlines, break results down by touchpoint, and share customer insights across teams.
Final thoughts
The best CSAT score isn't the highest number you can screenshot.
It's the one you can consistently measure, understand, and improve – across the customer lifecycle, across key moments, and across the teams responsible for the experience.
If you want to launch automated CSAT surveys, capture real-time customer feedback, and close the loop faster, Checkbox can help you build a program that's practical from day one. Request a Checkbox demo today.
CSAT score FAQs


Contact us
Fill out this form and our team will respond to connect.
If you are a current Checkbox customer in need of support, please email us at support@checkbox.com for assistance.
