Employee net promoter score: how to measure, benchmark, and improve eNPS
Your organization may measure employee engagement in some form, but it might not benefit from a single, consistent number that shows whether employees would actually recommend the company as a place to work. That gap matters.
Employee net promoter score fills that gap. Often shortened to eNPS, it gives HR teams and business leaders a simple way to measure employee sentiment, understand how invested they are in the business, monitor trends over time, and spot whether culture is moving in the right direction.
eNPS is quick to run, easy to explain, and useful as an early signal for retention risk, employee loyalty, and overall company culture health.
In this guide, you’ll learn how to calculate employee net promoter score, what a good score looks like, where current benchmarks sit, how to improve employee net promoter score, and which employee net promoter score questions to ask.
What is an employee net promoter score?
eNPS is an employee engagement metric built on a single recommendation question. That question, usually part of a longer eNPS survey, asks whether an employee would recommend the company as a place to work.
Employee net promoter score adapts the net promoter score methodology, which was originally designed to measure customer loyalty, into a metric for employee experience.
That one question produces three respondent groups:
- Promoters score 9 or 10 and are your strongest advocates
- Passives score 7 or 8 and are broadly satisfied, though not enthusiastic enough to actively promote the organization
- Detractors score anywhere from 0 to 6 and are more likely to reflect frustration, disengagement, or employee dissatisfaction
The value of the scoring system is its simplicity: one core question, one clear output, and a format that makes it easier to measure eNPS consistently across teams and over time.
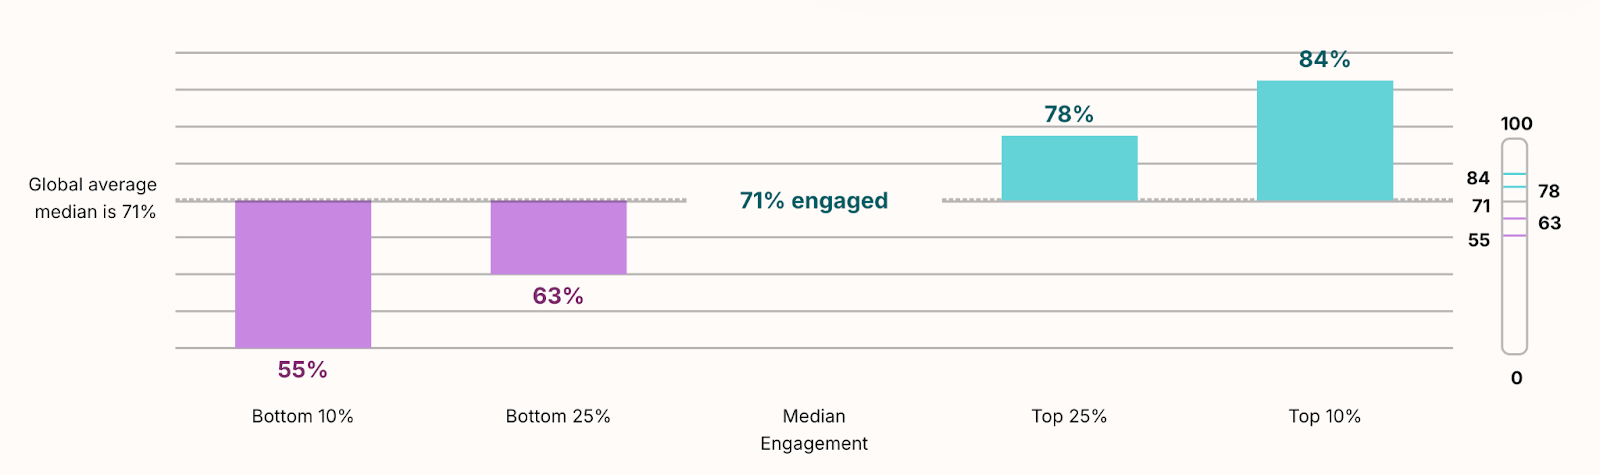
Gallup’s State of the Global Workplace 2026 report found that only 20% of employees worldwide are engaged. An eNPS question gives you a place to start to understand the underlying numbers that could be causing a lack of engagement—then, running an employee engagement survey is always a good next step.
Why eNPS matters
Because employee net promoter score is so simple, it is easy to underestimate it.
A strong eNPS score often points to a healthier employee experience, a stronger employer brand, and better odds of retaining high-quality talent. There is also a link (identified by Gallup in their report) between engaged teams, productivity, sales, and profitability.
Promoters are more likely to refer candidates, speak positively about the business, and stay longer.
Detractors, by contrast, often surface manager effectiveness issues, trust problems, or workload pressure before they show up in attrition data.
eNPS, then, is a leading indicator rather than a lagging one. When you measure employee net promoter score regularly, you are not just taking a snapshot of employee morale. You are building an early warning system that can help leadership act before turnover rises or culture slips.
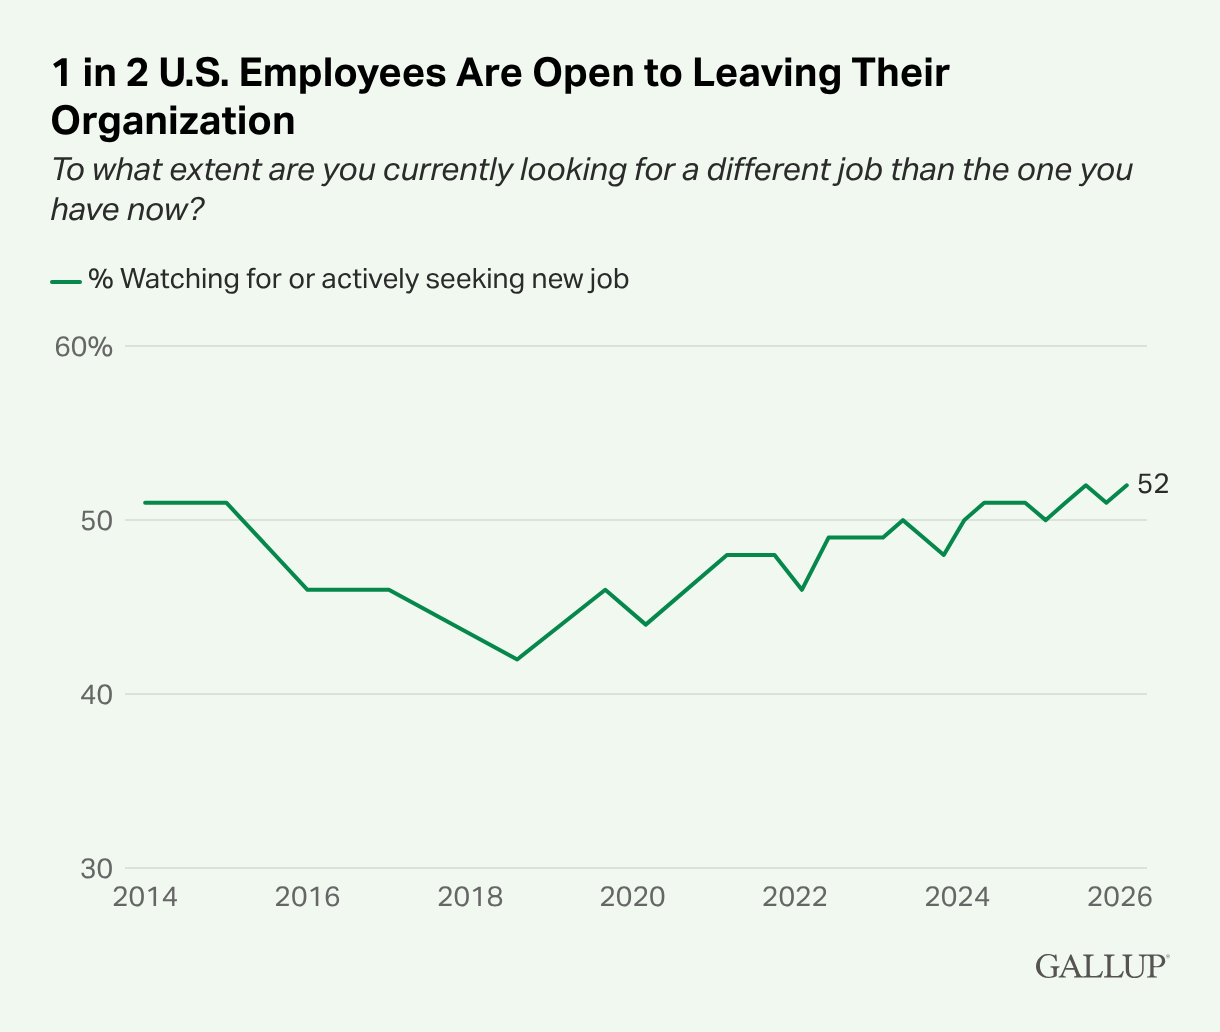
With 52% of U.S. employees open to leaving their jobs, a number that has grown steadily since 2019, knowing your eNPS score and understanding how your employees value your organization is paramount.
How to calculate employee net promoter score
The eNPS score calculation is straightforward:
eNPS = percentage of Promoters − percentage of Detractors
Passives still matter because they are part of the total response pool, but they’re not included in the final subtraction. The score can range from −100, if every respondent is a Detractor, to 100, if every respondent is a Promoter.
Here is a simple example: 200 employees complete your employee NPS survey.
Out of that group:
- 120 are Promoters
- 50 are Passives
- 30 are Detractors
First, convert those groups into percentages: 60% Promoters, 25% Passives, and 15% Detractors. Then subtract 15 from 60.
Your employee net promoter score is 45.
One reason so many HR teams use eNPS is that the formula stays the same regardless of company size. You can calculate eNPS for the whole business, for a department, for a location, or for a specific tenure group and still compare results on a like-for-like basis.
What is a good employee net promoter score?
A good employee net promoter score depends on context, so there’s no single universal threshold that works for every organization. However, according to Culture Amp, the median eNPS score is 17.
In most cases, a score below 0 is a red flag. A score from 0–10 is often treated as average. A score from 10–30 is good. A score from 30–50 is great. A score above 50 is excellent.
Trend matters just as much as the absolute number. A company’s eNPS moving from −5 to 20 in a year usually tells a more encouraging story than a score that stays flat at 10.
Survey cadence, company size, workforce mix, and methodology all shape what an acceptable score looks like in practice. Culture Amp’s benchmark datasets show that industry medians vary, which is one more reason not to judge your score in isolation.
eNPS benchmarks by industry
Current public eNPS benchmark data by industry is limited, and not every provider publishes open medians. For these reasons and more, benchmarking against your own scores can be more valuable than benchmarking against organizations like yours.
However, Culture Amp’s benchmark dataset published in January 2026 shows the following median eNPS scores by sector:
- Technology: 17 median eNPS, with 71% of employees engaged in the benchmark set.
- Healthcare: 17 median eNPS, with 71% engaged.
- Financial services: 20 median eNPS, with 74% engaged.
- Retail: 20 median eNPS, with 70% engaged.
- Professional services: 21 median eNPS, with 73% engaged.
Those numbers are helpful, but they’re still only reference points.
They were collected over a defined period and will shift year on year, just as employee expectations shift. Internal benchmarking is usually more actionable than external comparison alone, because it shows whether your own improvement process is working.
How to improve your employee net promoter score
Knowing your score is useful. Improving it is where eNPS starts to deliver business value. The most effective approach is not to chase the number directly, but to fix the conditions that create Promoters and reduce the causes of Detractors.
Close the loop visibly and quickly
The fastest way to weaken trust in an eNPS survey is to ask for honest feedback and then do nothing with it.
Employees are far more likely to keep participating when they can see what changed as a result of survey responses. A simple follow-up from leadership, manager action plans, and regular progress updates can turn a one-off score into continuous improvement.
Run pulse surveys between eNPS cycles
An annual or biannual eNPS survey tells you where you landed. Pulse surveys help you understand why the number moved. Shorter, more targeted check-ins make it easier to monitor trends, reduce survey fatigue, and catch issues while they are still fixable.
Annual surveys give a broad snapshot, while pulse surveys provide fast, timely feedback you can act on quickly.
Address manager quality
Gallup’s research is hard to ignore here. In its 2026 workplace report, Gallup says that “in organizations investing in AI, the strongest predictor of employee adoption, aside from technical integration, is whether their direct manager actively champions it.”
When Detractor patterns cluster around one team or function, the problem is often not the company at large; it’s a local management issue.
Better manager coaching, clearer expectations, and stronger feedback habits can have a disproportionate effect on eNPS data because managers shape so much of the day-to-day employee experience.
Segment results by department, tenure, and role
A company-wide employee net promoter score is useful, but it can hide the patterns that matter most.
New hires might feel very differently from long-tenured employees. Frontline teams may score differently from office-based functions. Leaders often get the most valuable insights when they break eNPS data down by team, location, tenure, and job level. Combine employee voice with demographic data to build a more complete picture of the workforce.
Improve the onboarding experience
New hire eNPS is one of the clearest ways to see whether your culture matches the promise candidates were sold during recruitment.
Measuring at 30, 60, and 90 days helps you catch friction early: unclear role expectations, weak manager support, poor communication, or a mismatch between stated values and daily reality.
When onboarding works well, employees settle faster, feel more connected, and are less likely to become early Detractors.
11 employee net promoter score questions you can use
The employee net promoter score is built on one core question, but follow-up questions are what turn a number into actionable insights.
On its own, an eNPS score tells you how people feel. A stronger employee survey tells you why they feel that way. eNPS is not robust enough as a standalone measure. Checkbox supports dynamic survey logic with conditions and branching, so you can tailor follow-up questions by response type without making the survey longer for everyone.
- On a scale of 0–10, how likely are you to recommend [Company] as a place to work? This is the core eNPS question. It gives you the promoter score that every other insight will build on.
- What is the main reason for your score? This is the most important open-ended follow-up. It helps you understand whether pay, leadership, workload, growth, manager effectiveness, or culture is driving the response.
- What does the company do particularly well as an employer? Promoters often reveal what should be protected and repeated. That helps you identify the strengths behind a positive work environment.
- What is the one thing that would most improve your experience working here? Asking for one priority keeps answers focused and makes it easier to spot themes across survey results.
- Do you feel your contributions are recognized and valued? Recognition has a direct effect on employee morale and on whether employees feel seen by the organization.
- How would you rate your relationship with your direct manager? This question helps you connect employee sentiment to management quality without assuming every issue is company-wide.
- Do you feel you have clear opportunities to grow your career here? Growth is one of the clearest drivers of employee loyalty, especially for ambitious or early-career employees.
- How well does leadership communicate the company’s direction and decisions? Weak communication often shows up in passive or negative scores before leaders realize trust is slipping.
- How manageable is your current workload? Work pressure is a common reason employees move from satisfied to frustrated. This question helps you identify burnout risk early.
- How closely does the company’s day-to-day culture reflect its stated values? This question helps you test whether the lived employee experience matches the employer brand.
- How well do you feel the company’s vision is communicated? A clear sense of direction strengthens alignment, while confusion here often drags down employee engagement.
Used together, these questions give HR teams far more than an eNPS score. They create the context needed to understand employee responses, identify areas for action, and build a more effective employee NPS survey over time.
Final thoughts
Employee net promoter score is one of the most practical ways to keep a real-time pulse on employee sentiment. It gives you a clear measure of advocacy, helps you calculate eNPS in a consistent way, makes it easier to compare results against internal and external benchmarks, and becomes far more useful when paired with smart follow-up questions.
That combination is where Checkbox can help. Checkbox’s employee feedback solution gives HR teams a flexible way to build, run, and analyze eNPS surveys with customizable question sets, branching logic, and reporting that makes trends easier to act on.
If you want a simpler way to measure employee experience and turn survey data into action, explore Checkbox or request a demo.
Employee net promoter score FAQs


Contact us
Fill out this form and our team will respond to connect.
If you are a current Checkbox customer in need of support, please email us at support@checkbox.com for assistance.
