What’s a semantic differential scale and how do you use one?
The semantic differential scale has been a cornerstone of psychological and market research since psychologist Charles Osgood, George Suci, and Percy Tannenbaum introduced it in 1957.
Their foundational book, The Measurement of Meaning, described the semantic differential as an objective method for measuring meaning, adaptable across fields such as psychology, linguistics, mass communications, and political science.
Its staying power is thanks to the fact that its format is simple for respondents, but analytically rich for researchers. Instead of asking whether someone agrees with a statement, a semantic differential scale asks where their perception sits between two opposing adjectives.
A respondent might see a brand as modern but distant, or a workplace as collaborative but draining. Semantic differential scale questions help capture those subtle differences by turning qualitative judgments into structured, quantitative data.
In this guide, we’ll cover what a semantic differential scale is, how it works, semantic differential scale examples, how to write strong semantic differential scale questions, how it compares with a Likert scale, why researchers use it, and how to analyze the results.
What is a semantic differential scale?
A semantic differential scale is a rating scale that measures the connotative meaning of a particular concept, object, person, brand, product, or experience by asking respondents to place their opinion between two opposing adjectives.
Each bipolar adjective anchors one end of the scale. The respondent then selects the point that best reflects their perception. A simple example might look like this:

Semantic differential scales are most useful when you want to understand how respondents perceive something, rather than whether they accept or reject a statement.
Osgood, Suci, and Tannenbaum identified three main dimensions measured through this method:
How does a semantic differential scale work?
A survey presents a subject or concept at the start of a question. That subject or concept might be a company, product, policy, service, website, advertisement, manager, or workplace culture. Beneath it, respondents see a series of rows. Each row contains two opposing adjectives with a numbered scale between them.
For example:
How would you describe your experience with our support team?
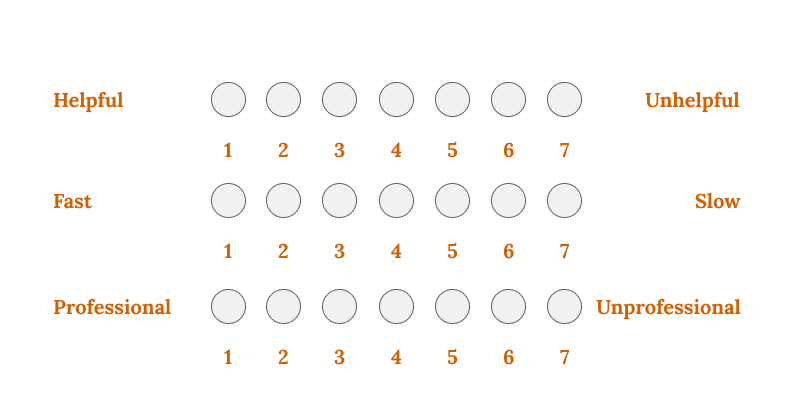
Respondents choose the point that best matches their perception. A score closer to “helpful” shows a more positive perception of that attribute, while a score near the middle suggests neutrality, uncertainty, or a mixed view, depending on how the question is framed.
Seven-point scale formats are common in research as they offer enough granularity to detect meaningful differences. Five-point scales are also widely used, especially when the survey needs to feel simpler on mobile devices or when the audience may have limited time.
The most important design feature of a semantic differential scale is bipolarity. Both endpoints carry meaning, making the scale different from a unipolar scale, which usually moves from none to a high amount of an attribute, such as “not at all satisfied” to “very satisfied.”
Semantic differential scale examples
In research, semantic differential scales are often used to study the emotional and perceptual associations people attach to various concepts. They have benefits across market research, employee experience, customer satisfaction, user experience (UX) research, and social sciences.
Brand perception research
Concept being rated: Acme Software
A brand team can use semantic differential scale surveys to measure how customers perceive a company after a rebrand, campaign, or product launch.

A brand perception study like this sheds light on whether the intended positioning is reaching customers. A company might want to be seen as modern and approachable, but the data shows that customers see it as modern and distant – that difference is useful for decision-making.
Product evaluation
Concept being rated: The new mobile app
Product and UX research teams can use semantic differential questions to understand how an experience feels, not just whether people completed a task.
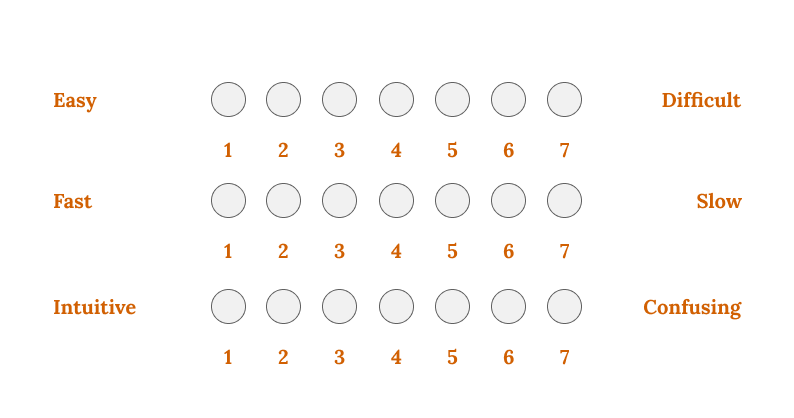
These responses highlight specific attributes that need work. If users rate the app as fast but confusing, the issue may be information architecture rather than performance.
Employee experience surveys
Concept being rated: Our company culture
Human resources and people teams can use bipolar adjective scales to gather feedback on emotional attitudes toward the workplace.

This format works well when the goal is a more nuanced understanding of culture. A company might score well on collaboration but poorly on fairness, which helps leaders understand what they need to focus on to motivate employees.
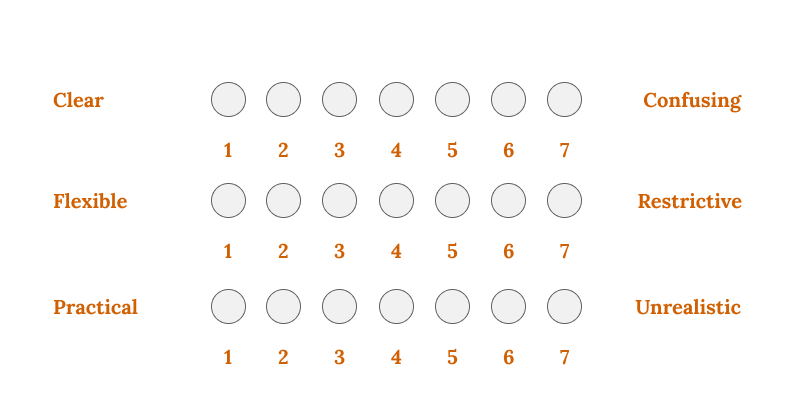
Policy or message testing
Concept being rated: The proposed remote work policy
Organizations can also use semantic differential scales to understand how people interpret policies, announcements, or internal communications.
How to write semantic differential scale questions
Good semantic differential scale questions need good adjective pairs. Poorly chosen endpoints are one of the most common sources of confusion, because respondents may not know what dimension they’re being asked to judge.
Use true opposites
The two adjectives should be antonyms and have opposite meanings. Pairs like fast and slow or fair and unfair work because they clearly describe two extremes on the same dimension.
Avoid pairs such as fast and complicated. A product can be both fast and complicated, so the pair isn’t really bipolar.
Keep language neutral
Avoid loaded adjectives that push respondents toward one end of the scale. A pair like responsible and reckless may be appropriate in some safety research, but it can feel leading in a general brand study.
Neutral language enables respondents to answer honestly rather than trying to identify the response the survey owner wants.
Match pairs to the concept
Choose adjective pairs that fit with whatever’s being measured:
- Evaluative pairs, such as good and bad, suit general opinion questions
- Potency pairs, such as powerful and weak, work well for brand or product research
- Activity pairs, such as dynamic and static, are useful for culture, communications, and organizational research.
The closer the adjective pair is to the research objective, the easier it becomes to interpret the responses.
Limit the number of pairs
For most survey design projects, 6–10 adjective pairs per concept is a practical range. It gives researchers enough detail to identify patterns without making the question feel repetitive.
If you need to test many different attributes, consider splitting the survey into sections or using logic to reduce respondent burden.
Common semantic differential adjective pairs include:
- Good and Bad
- Trustworthy and Untrustworthy
- Clear and Confusing
- Strong and Weak
- Powerful and Powerless
- Modern and Outdated
- Active and Passive
- Dynamic and Static
- Fair and Unfair
Semantic differential scales vs. Likert scales
Semantic differential scales and Likert scales are often confused because both are rating scale formats and both can use five or seven response points. The difference is in what they ask respondents to decide on.
A Likert scale measures the strength of agreement or disagreement with a statement. Rensis Likert introduced his approach in the 1932 work A Technique for the Measurement of Attitudes.
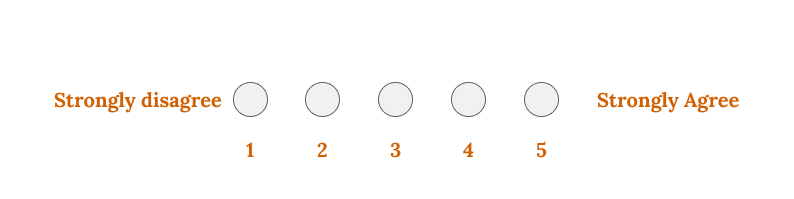
A Likert scale question might look like this:
The product is easy to use.
A semantic differential scale measures where a respondent’s perception sits between two opposing concepts:

Likert scales measure the intensity of agreement with a claim, while semantic differential scales measure the direction and position between two polar adjectives.
Neither format is universally better. If you want to test whether people agree with a specific claim, a Likert scale is usually cleaner. If you want to understand how people experience a product, brand, service, or workplace, a semantic differential scale offers a more direct way to capture perception.
Why use a semantic differential scale?
When you need to measure attitudes, a semantic differential scale is a powerful tool.
Yes/No questions can flatten opinion. Simpler rating scales can tell you whether something is positive or negative, but they may not show what kind of positive or negative perception exists. A semantic scale gives you more detailed insights by breaking perception into specific attributes.
For example, two brands may receive similar customer satisfaction scores. A semantic differential scale might show that one is seen as reliable but old-fashioned, while the other is seen as modern but less trustworthy. That’s a deeper understanding than a single satisfaction score can provide.
Researchers use semantic differential scales because they:
- Capture nuance in consumer perceptions, employee attitudes, and user experiences
- Turn qualitative judgments into quantitative data
- Make it easier to compare groups, segments, or time periods
- Work across brand tracking, UX research, employee engagement surveys, and academic psychology
- Support recurring measurement of attitudes toward the same concept
There’s also a methodological reason to take bipolar scales seriously. Research on measurement properties has found that end-labeled unipolar and bipolar scales performed well on equidistance criteria, while also warning that results from differently structured scales may not be directly comparable.
Related consumer research also shows why mixed or complex affect deserves careful measurement. Aaker, Drolet, and Griffin found that the intensity of mixed emotions is underestimated at recall, and that this pattern differs from unipolar emotions.
In plain terms, people’s attitudes can be layered, and the way you ask questions affects what you can see.
How to analyze a semantic differential scale
Analyzing a semantic differential rating scale is usually straightforward – another one of its practical strengths. The data is commonly treated as interval-level data in research contexts, meaning researchers often calculate averages and use statistical tests such as t-tests or analysis of variance (ANOVA) when comparing groups.
The right approach depends on the research goal.
Mean scores
Start by calculating the mean score for each adjective pair across all respondents.
If “trustworthy” to “untrustworthy” is scored from 1 to 7, with 1 representing trustworthy, a mean score of 2.1 suggests respondents lean strongly toward trustworthy. A mean score of 5.9 suggests they lean toward untrustworthy.
Mean scores give you a simple view of each specific attribute.
Profile analysis
Profile analysis plots the mean score for each adjective pair on a visual chart. The result is often called a semantic profile.
Profile analysis is especially useful when comparing two groups or two points in time. You might compare new customers with long-term customers, or brand perceptions before and after a campaign. Overlaying profiles makes subtle differences easier to spot than a table of numbers alone.
Dimension scoring
You can also group adjective pairs into Osgood’s three dimensions: evaluative, potency, and activity.
For example, good and bad, fair and unfair, and pleasant and unpleasant might contribute to an evaluative score. Strong vs. weak and powerful vs. powerless might contribute to a potency score. Active vs. passive and dynamic vs. static might contribute to an activity score.
Composite scores give you a higher-level view of how respondents perceive the concept.
Cross-group comparison
Cross-group analysis compares responses by segment. That might mean demographic groups, customer types, departments, regions, or survey waves.
For example, a product team might discover that new users rate an interface as confusing, while experienced users rate it as intuitive. That difference points to an onboarding problem, making it more actionable than an overall average.
The aim isn’t just to produce a score. It’s to gain insight into how perceptions differ, where they’re changing, and which attributes need attention.
Final thoughts
The semantic differential scale is a versatile and analytically robust way to measure perception, attitude, and meaning. It respects the texture of human judgment: People rarely feel just positive or negative about a particular concept; they see it through different attributes, emotions, and associations.
The quality of the insight depends on the quality of the scale. Choose the right format, write clear bipolar adjective pairs, give respondents clear instructions, and analyze the results in a way that connects back to your research question.
With Checkbox, you can build and deploy semantic differential scale surveys using a flexible survey builder that supports research teams across market research, employee experience, customer satisfaction, and more. Checkbox’s no-code survey maker lets teams build custom surveys, add logic, customize the experience, and analyze survey results in clear charts and tables.
Request a Checkbox demo today.
Semantic differential scale FAQs


Contact us
Fill out this form and our team will respond to connect.
If you are a current Checkbox customer in need of support, please email us at support@checkbox.com for assistance.
