Closed-ended questions: types, examples, and how to use them
Closed-ended questions are integral to effective data collection. With them, you can turn opinions, behaviors, and experiences into structured responses that can be compared and segmented, over time to identify insights and trends, without wading through thousands of text responses first.
If you're running any type of research – such as user research, a market study, or a voice-of-customer program – with the right closed-ended questions, you can collect survey responses at scale and gather quantifiable data you can actually use.
In this guide, you'll learn what closed-ended questions are, see the differences between open-ended vs. closed-ended questions in practice, and get closed-ended questions examples you can copy-paste and a practical data analysis process you can reuse for your next report.
What are closed-ended questions?
Closed-ended questions are survey questions with predefined answers. Instead of asking people to answer freely in their own words, you provide a limited range of possible responses, such as Yes/No, multiple-choice, rating scale questions, or checklist-style questions.
Thanks to that structure, the data you collect is easier to interpret. You can gather numerical data, run statistical analysis techniques, and create dashboards that compare responses across segments.
Here are two simple closed-ended question examples:
- Do you currently use a market research platform? (Yes / No)
- How satisfied are you with the checkout experience? (Very dissatisfied / Dissatisfied / Neutral / Satisfied / Very satisfied)
Key examples of what a closed-ended question is
Most questions qualify as "closed" if they use fixed responses or pre-determined answer options:
- Dichotomous questions – Two possible answers (Yes/No, True/False)
- Multiple-choice questions – Single-select or multi-select (checkbox-style)
- Scale questions – Rating scale, numerical scale, and Likert scale questions
- Ranking – Ordering items by preference or priority
- Matrix – Repeating the same scale across multiple statements
You can also add "Other (please specify)" to keep the benefits of having a closed-ended question while also allowing your respondents to provide more qualitative insights.
Open-ended vs. closed-ended questions
Respondents can provide detailed responses to open-ended questions in their own words. They're ideal for qualitative data, where you discover language, uncover edge cases, understand sentiment, and get direct insight into motivations.
You get quantitative data from closed-ended questions, which is structured data you can count, chart, and run statistical analyses on. They're ideal when you need to collect consistent data from many survey respondents, especially in large-scale surveys. You may also have heard them referred to as quantitative questions.
Here's a quick side-by-side comparison of open-ended and closed-ended questions, but if you want a deeper walkthrough of open formats, see our guide to writing open-ended questions.
When to use a mix of both in one survey
Combining open- and closed-questions is common practice in a survey, but can be especially powerful if you have one immediately following the other.
For example, try adding a closed-ended metric question just before an open-ended follow-up:
- Net promoter score (NPS) – "On a scale of 0–10, how likely are you to recommend our product to a friend or colleague?"
- Open-ended follow-up – "What's the main reason for your score?"
That pairing gives you quantifiable data for trend reporting, as well as the qualitative depth to explain the trends in the data, making it especially powerful if you're asking the same group this question across repeat surveys.
It's also a practical way to apply sentiment analysis later to open text, without making every question require careful analysis.
Types of closed-ended questions and when to use each
Closed-ended questions work best when you start from the decision you need to make and the data you need to make it. Are you qualifying participants, measuring change, choosing a direction, or segmenting a target audience?
Below is a skimmable breakdown of the most common closed question types, what they're good for, and what to watch out for.
Dichotomous questions (Yes/No or True/False)
Dichotomous questions offer two possible answers. They're an essential tool when you're screening and gating logic, or for simple checks where a one-word answer or single-word answer is enough.
Use them for:
- Eligibility – "Are you currently employed?" (Yes/No)
- Behavior – "Did you contact support in the last 30 days?" (Yes/No)
- Compliance – "Do you consent to participate?" (Yes/No)
- Data retention – "Are you happy for us to retain your email to contact you about this survey at a later date?" (Yes/No)
Watch out for nuance. If "it depends" is common, add a third option like "Not sure" or "Not applicable" to avoid forced choice bias.
Multiple-choice (single-select and multi-select)
Multiple-choice questions are great for categorizing and counting. They help you gather quantifiable data quickly and cleanly as all your respondents are selecting from the same set of answers.
Use single-select (radio buttons) when options are mutually exclusive:
- "Which plan are you on?" (Basic / Pro / Enterprise)
Use multi-select (checkboxes) when more than one can apply:
- "Which social media platforms do you use weekly?" (Instagram / TikTok / LinkedIn / X / YouTube / Other)
A simple rule to follow is that, if selecting multiple options makes sense in real life, use checklist-style questions, whereas if it creates ambiguity in data analysis, force a single choice.
Rating scales and Likert scales
Rating scale questions are your go-to for satisfaction, ease, agreement, and frequency. Likert scale questions are a specific style of rating scale where people indicate how much they agree with a statement, commonly across 5 or 7 points.
Use them both for:
- Attitudes – "I can complete tasks without support." (Strongly disagree → Strongly agree)
- Frequency – "How often do you use feature X?" (Never → Very often)
- Tracking – Repeating the same numerical scale in quarterly surveys
Keep endpoints consistent across your survey. If you switch between 1–5 and 1–7, or flip labels mid-survey, you'll make it harder to compare responses when you start analyzing the data and potentially make it more complicated for respondents to complete your survey.
Ranking questions
Ranking questions force prioritization trade-offs. They're useful when "everything matters" is a common outcome in rating scales, as they encourage participants to make a clear judgement about what's most important to them.
Use them for:
- Feature priority – "Rank these improvements by impact."
- Messaging tests – "Rank these value propositions."
Keep lists short. If you ask someone to rank 12 items on mobile, completion drops, meaning lower data quality.
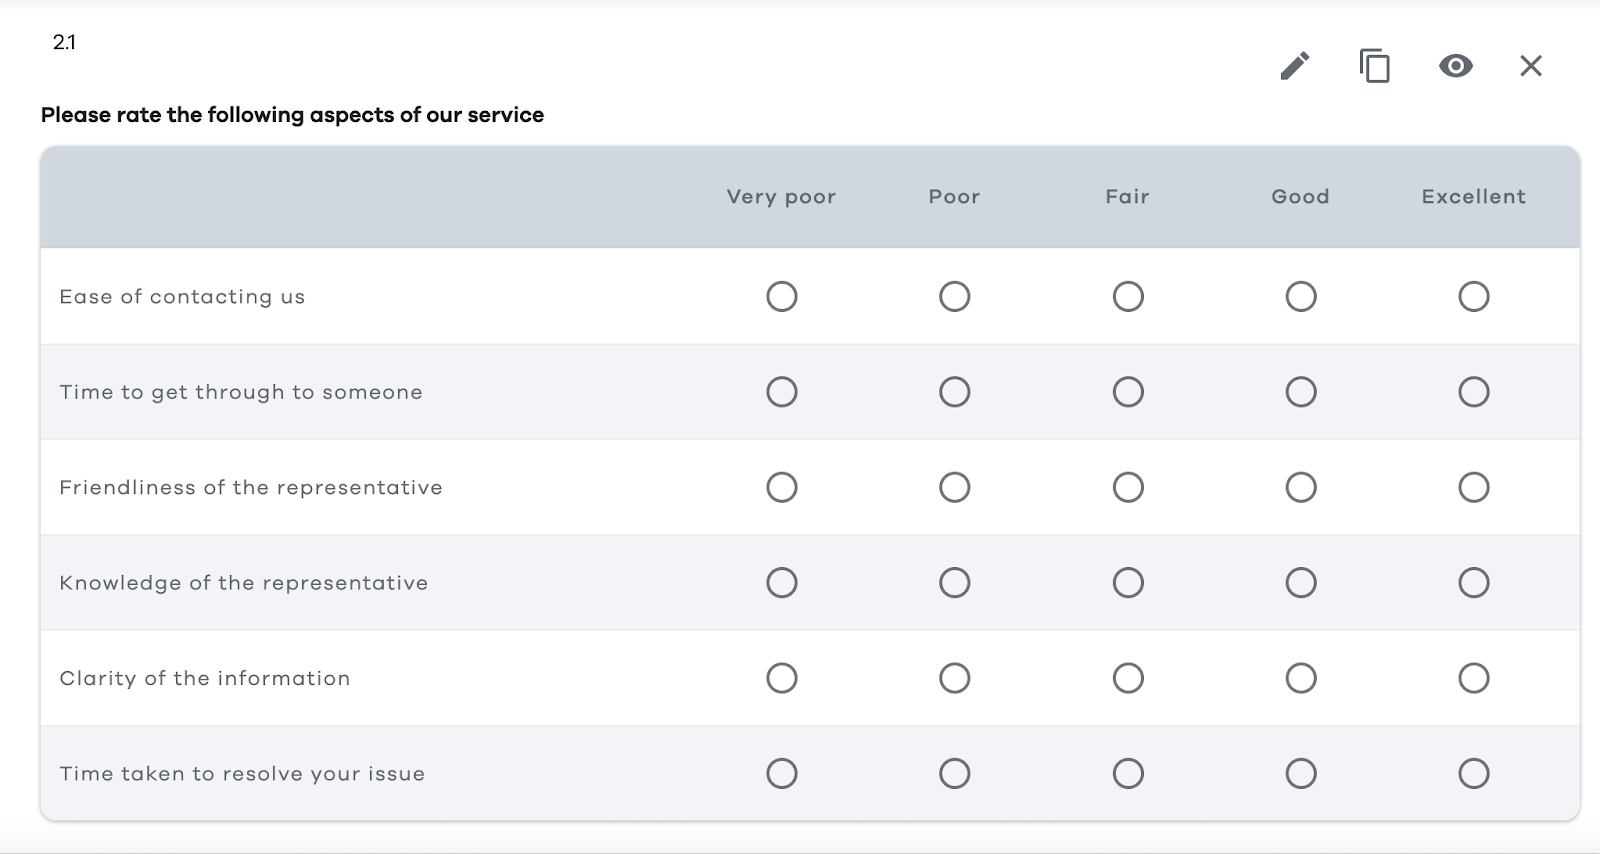
Matrix questions
Matrix questions place multiple, related questions into one compact grid, using a shared set of answer options. They can speed up data collection, but they can also cause fatigue, straight-lining, and mis-taps on mobile.
If you use a matrix:
- Limit the number of rows
- Keep labels visible and unambiguous
- Consider splitting into multiple smaller questions if accuracy matters more than speed
- Limit the number of matrix questions you use, especially if you need to use them consecutively
Here's an example of a matrix question:
Other closed-ended question types
There are plenty of other useful formats to use when you're testing concepts or interactions, especially in product feedback and user research. They still produce structured responses, but they can feel more engaging than standard multiple-choice.
- Image choice – If you've ever completed a Captcha test, you'll likely be familiar with image-choice questions where you're asked to select all the images that apply.
- Star ratings – An alternative to Likert scales, star ratings are especially useful if you're looking for a rating you can use in marketing materials.
- Sliders – Another Likert scale alternative that offers more tactility for mobile and touchscreen users.

Closed-ended question examples you can copy-paste
Below are closed-ended question examples grouped by common research objectives. Each set is written to be dropped in to your existing surveys, with clear stems and answer choices you can adapt.
Customer satisfaction (CSAT / customer effort / NPS-style)
- Overall satisfaction (CSAT) – "How satisfied are you with your experience today?" (Very dissatisfied / Dissatisfied / Neutral / Satisfied / Very satisfied)
- Customer effort score (CES) – "To what extent do you agree with the following statement: '[Company] made it easy for me to handle my issue.'" (Strongly disagree / Disagree / Somewhat disagree / Neither / Somewhat agree / Agree / Strongly agree)
- Resolution clarity – "Was your issue fully resolved today?" (Yes / No / Partially)
- Speed perception – "How long did it take to get the help you needed?" (Less than 5 minutes / 5–15 minutes / 16–30 minutes / More than 30 minutes)
- Net promoter score (NPS) – "On a scale of 0–10, how likely are you to recommend us to a friend or colleague?" (0: Not at all likely … 10: Extremely likely)
- Support channel preference – "Which support channel did you use?" (Email / Live chat / Phone / Help center / Social media / Other)
- Next-step clarity – "After this interaction, do you know what to do next?" (Yes / No / Not sure)
- Follow-up willingness – "May we contact you about your feedback?" (Yes / No)
If you're building a full program, you can find more question templates in our voice of the customer survey questions article or use our guide to creating customer satisfaction surveys.
Product feedback and UX
- Task success – "Were you able to complete [task] today?" (Yes / No / Not applicable)
- Friction point identification – "Where did you get stuck?" (Sign-up / Onboarding / Search / Checkout / Settings / I didn't get stuck)
- Feature usage frequency – "How often do you use [feature]?" (Never / Rarely / Sometimes / Often / Very often)
- Value perception – "How valuable is [feature] to your workflow?" (Not valuable / Slightly valuable / Moderately valuable / Very valuable / Essential)
- Preference test (single-select) – "Which layout do you prefer?" (Option A / Option B / No preference)
- Checklist (multi-select) – "Which benefits matter most to you? (Select all that apply.)" (Saves time / Reduces errors / Improves reporting / Easier collaboration / Better compliance / Other)
- Ranking – "Rank the following improvements by priority (1 = highest priority):" (Faster load times / Better search / More integrations / Improved exports / Custom branding)
- Commitment signal – "How likely are you to use [feature] in the next month?" (Very unlikely / Unlikely / Neutral / Likely / Very likely)
If you're writing your full questionnaire from scratch, use our survey question guide as a useful starting point for phrasing and structure.
Employee engagement and HR pulse
- eNPS-style – "On a scale of 0–10, how likely are you to recommend your organization as a place to work?"
- Manager support (Likert) – "To what extent do you agree: "My manager supports my development." (Strongly disagree → Strongly agree)
- Workload sustainability – "How manageable is your workload right now?" (Not manageable / Somewhat manageable / Manageable / Very manageable)
- Psychological safety – "I feel safe speaking up when something isn't working." (Strongly disagree → Strongly agree)
- Recognition frequency – "In the last two weeks, have you received recognition for your work?" (Yes / No / Not sure)
- Intent to stay – "How likely are you to still be here in 12 months?" (Very unlikely / Unlikely / Neutral / Likely / Very likely)
Demographics and segmentation
Demographic closed-ended questions help you segment survey findings and run cross-tabs. Keep them inclusive, and consider "Prefer not to say" options.
- Employment status – "What is your current employment status? (Employed full-time / Employed part-time / Self-employed / Student / Unemployed / Retired / Prefer not to say / Other)
- Role – "Which best describes your role?" (Individual contributor / Manager / Director / Executive / Other)
- Industry – "What industry do you work in?" (Technology / Healthcare / Finance / Education / Government / Nonprofit / Other)
- Region – "Where are you located?" (North America / EMEA / APAC / LATAM / Prefer not to say)
For more templates designed for research teams, you can also browse our market research survey questions.
When and why are closed-ended questions used?
If you've ever tried to summarize 3,000 open-ended responses in a week, you already know the appeal of closed-ended questions, because they make effective data collection at scale more achievable.
They help you:
- Collect data quickly – Survey respondents can answer in seconds, especially on mobile
- Standardize results – Everyone responds from the same set of possible responses
- Simplify reporting – Structured data feeds charts, dashboards, and statistical analysis
- Track change over time – Consistent scales make trends meaningful
- Support segmentation – You can ask "how many customers" in each cohort, plan, or region
Multiple-choice questions can also be easier to answer on small screens as they can be answered in a single tap rather than with text, hence supporting mobile completion.
Pros and cons at a glance
Here are the benefits and Limitations of closed-ended questions:
The sweet spot for many teams is to use mostly closed-ended questions, with some optional open-ended follow-ups to gather more qualitative data.
How to write better closed-ended questions
The creation of good closed-ended questions starts with the decision you want to make from the data, even before you've started on potential responses. For example, if you're conducting a customer survey, you may be making a decision about how you can improve your customer support process.
Use this checklist as your default workflow:
- Write the decision first – What will you do differently depending on the answer?
- Choose the right structure
- Use dichotomous questions for gating and clear checks
- Use multiple-choice for categories
- Use rating scale questions for intensity or change
- Use ranking questions for trade-offs
- Keep wording neutral – Avoid emotional framing and loaded language. If your questions require careful analysis, simplify the stem rather than adding an explanation.
- Make options MECE (mutually exclusive, collectively exhaustive) – Overlaps create messy structured responses. Missing options create junk "Other" text you can't analyze cleanly.
- Add "Other" thoughtfully – Use "Other (please specify)" when you genuinely can't predict every possible answer. Keep it optional unless it's critical to research objectives.
- Label scales clearly – Make endpoints clear. If you're using a numerical scale, show what the ends mean.
- Be consistent across the survey – If you use a 1–5 rating scale in one place and 1–10 elsewhere, you'll slow people down and complicate data analysis.
- Pilot test with a small group – A quick pilot reveals confusing wording, missing predefined answers, and places where respondents want to answer in their own words.
Answer option designs that prevent messy data
Most data issues come from option design, not from statistics.
Common fixes include:
- Use non-overlapping ranges (0–5, 6–10, 11–15), not (0–10, 10–20).
- Keep timeframes consistent ("in the last 7 days" everywhere, not "recently" in one place and "last month" in another).
- Include "Not applicable" when it's plausible, especially for feature usage questions.
- Keep answer choices balanced, especially on rating scale questions.
Common mistakes with quick fixes
Here are a few patterns that routinely distort survey responses, plus a cleaner alternative.
Leading language pushes people toward a "nice" answer
Leading wording can bias survey responses, especially on satisfaction and customer feedback questions. Keep the stem neutral so that survey respondents can pick an answer choice that matches their experience – not your framing.
- Bad – "How great was the new feature?"
- Better – "How would you rate the new feature?" (then use a rating scale)
Double-barreled questions gives you two topics, but one data point
Double-barreled questions make data analysis harder because you can't tell which part drove the answer. Split the question so each response maps to one clear thing you can measure and compare.
- Bad – "How satisfied are you with speed and support?"
- Better – "How satisfied are you with speed?" and "How satisfied are you with support?"
Unbalanced scales means your options don't match on both sides
An unbalanced rating scale can pull responses in one direction, which throws off quantitative data and trends. Use symmetrical labels and keep the "middle" option obvious.
- Bad – "Bad / OK / Good / Amazing"
- Better – "Very dissatisfied / Dissatisfied / Neutral / Satisfied / Very satisfied"
Missing answer options are when people guess, skip, or abandon
When the answer options don't reflect someone's reality, they'll either drop out or choose a "closest fit" that muddies your structured data. Add "Not applicable" where it's genuinely possible, and consider "Prefer not to say" for sensitive demographics and questions.
- Bad – "What's your income?" (no opt-out)
- Better – Include "Prefer not to say" (and "Other" only when you'll use it)
Too many answer options causes high friction and lower quality
Long lists slow people down and increase random clicking, especially on mobile. You'll still collect survey responses, but the survey findings can be harder to trust.
- Bad – One multiple-choice question with 20 similar possible answers
- Better – Group options, shorten the list, or use logic to show only relevant choices (plus "Other" if needed)
It's important to find the balance between getting the data you need and making the survey experience engaging. However, the solution isn't necessarily to make your survey effortless.
“If surveys are meant to capture meaningful feedback, they need to reflect how people actually think. If you're creating a survey, you need to design experiences that balance ease with reflection. You need to remove friction from clarity and structure while keeping friction where insight matters most.”
– Tarik Covington, Founder, Covariate Human-Centered Insights
A useful gut check is to see if you can imagine a respondent choosing a certain option; if not, it probably doesn't belong. If you can see someone asking, "What does this mean?" it needs rewriting.
How to analyze closed-ended questions
Teams love closed-ended data analysis because it's repeatable. Below is a workflow you can apply to most surveys, whether you're doing quantitative research in academia or product analytics in a business setting.
- Clean and validate the data collected – Check for duplicates, missing values, AI responses, and respondents who complete the survey too quickly. Decide how you'll treat "Not applicable" and partial completes.
- Run frequency distributions – Start simple with counts and percentages for each answer, as this is where fixed responses shine.
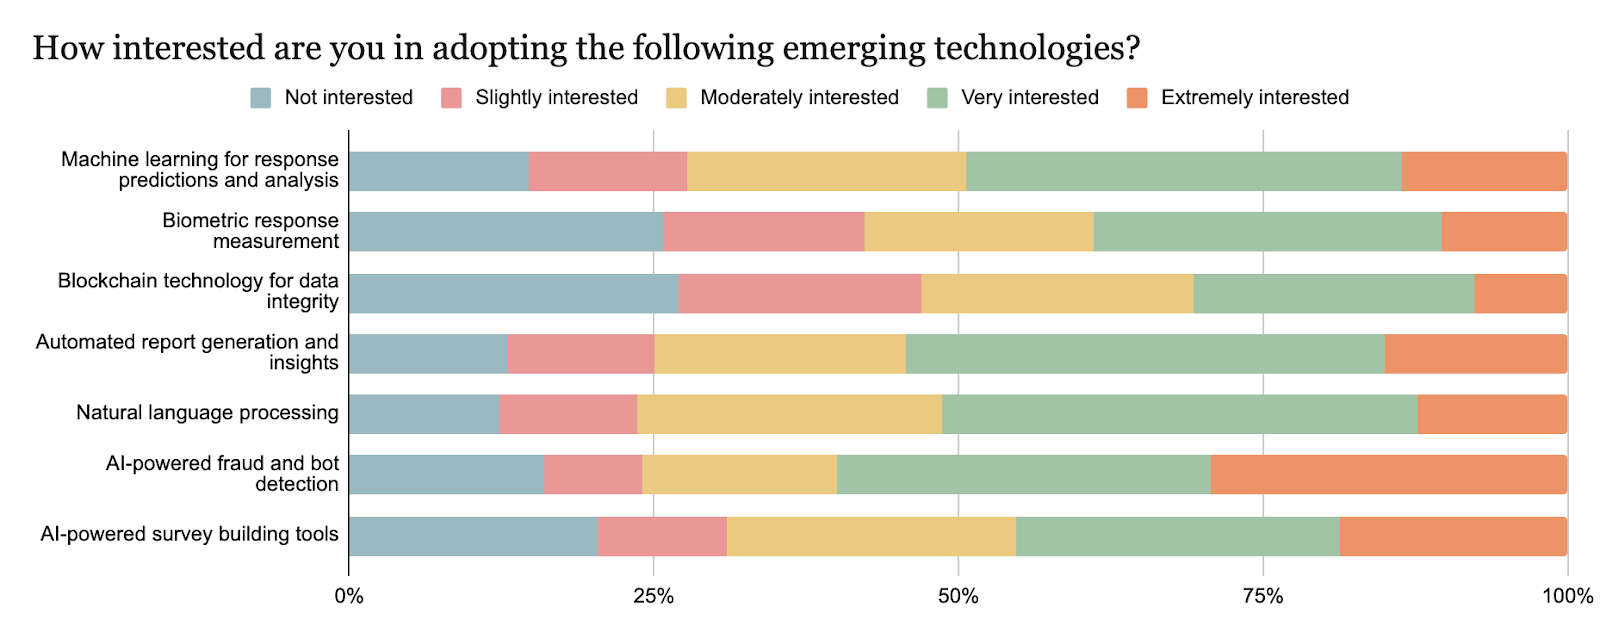
- Visualize key questions – Use bar charts for multiple-choice, pie charts for single-select, histograms for numerical scale questions, and stacked bars for Likert scale questions. Here's an example from our survey on trends in research:
- Calculate top-box and bottom-box for scales – "Top-box" refers to the % of respondents who chose the most positive option(s), while "Bottom-box" refers to the negative group. For a 1–5 rating scale, the top group might be 5 only, or 4–5 together. Choose a definition and keep it consistent.
- Add context with open-ended follow-ups – Use open-ended questions sparingly to explain the "why." Then use qualitative methods or sentiment analysis to summarize themes.
- Segment with cross-tabs – Compare responses by role, region, employment status, plan, or any particular aspect tied to your research objectives.
- Check for meaningful differences – If you're applying statistical analysis techniques to survey findings, confirm sample sizes per segment and use appropriate tests for your measurement level.
- Trend over time – Closed-ended questions let you track movement quarter over quarter. Keep question wording and answer options identical to avoid false shifts.
Analyzing rating scales responsibly
Individual Likert items are ordinal, which is why many researchers prefer medians, distributions, and top-box reporting. Averages can still be useful for tracking if you're consistent, transparent, and careful analysis is applied across waves.
Using closed-ended questions in Checkbox (design, distribute, and report)
Closed-ended questions are only as useful as your workflow for building surveys, collecting survey responses, and reporting results back to stakeholders.
Checkbox is designed to support that full loop:
- Design – Create surveys with common closed-ended formats, like multiple-choice, checkbox lists, scale questions, and dichotomous questions, plus logic to route survey respondents based on answers.
- Distribute – Share surveys through the channels your target audience actually uses, including email and other link-based options.
- Report – Turn structured responses into filtered views you can use for research readouts and ongoing tracking.
If you're working in regulated environments or need full data control, Checkbox also supports on-premise deployment for organizations with higher security requirements.
Also, if your survey program needs to connect to the rest of your stack, integrations and APIs can help you move structured data where it needs to go.
Final thoughts
Closed-ended questions help you measure, compare, quantify, and track what matters, quickly and efficiently. They're a practical tool for gathering quantifiable data from large samples, conducting cleaner data analysis, and converting survey findings into defensible decisions.
If you want the best of both worlds, pair closed-ended questions with open-ended follow-ups. You'll get structured data for reporting, plus the direct insight that only feedback in the respondents' own words can provide.
When you're ready to put this into practice, Checkbox makes it easy to build surveys, distribute them to the right audiences, and report on results with confidence – whether you need a standard setup or an on-premise environment built for data sovereignty. Request a Checkbox demo today.
Closed-ended questions FAQs


Contact us
Fill out this form and our team will respond to connect.
If you are a current Checkbox customer in need of support, please email us at support@checkbox.com for assistance.
