How to Create a Custom Dashboard Report
What is a Dashboard and how is it different from a report?
A Dashboard is a custom report based on survey data. We call it a Dashboard, rather than a report, because you can pick and choose the charts you want to include and also include charts from multiple surveys in a single Dashboard.
Dashboards are a little different from the Standard Report that is included for each survey. The Report tab for your survey includes charts/graphs for each question of your survey – these are automatically generated based on system defaults and only include slightly more limited customization options.
Dashboards, on the other hand, are created by you – they need to either be built chart by chart, in much the same way that you build a survey, or copied from a Standard Report. While it’s a little more work to create a custom Dashboard, the upside is that you can pick and choose the charts you want to include and also report on multiple surveys in a single Dashboard.
Just like the Standard Report, Dashboards present live data each time they are run or refreshed, can be exported to PDF, and can be shared via private or login-protected link.
How to Create a Dashboard
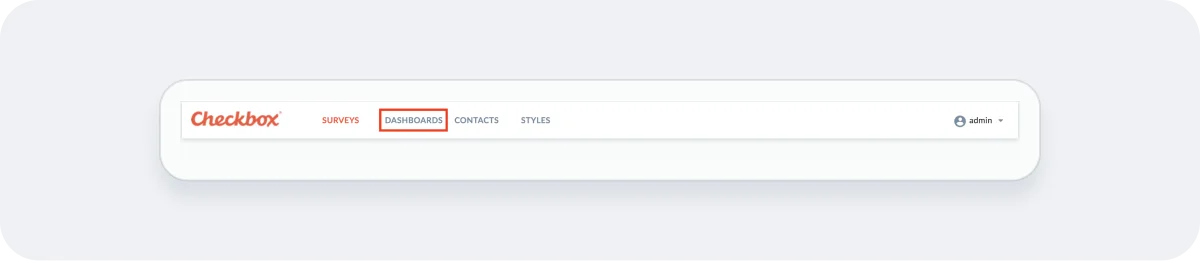
1. Navigate to Dashboards
Click on "Dashboards" in the global navigation.
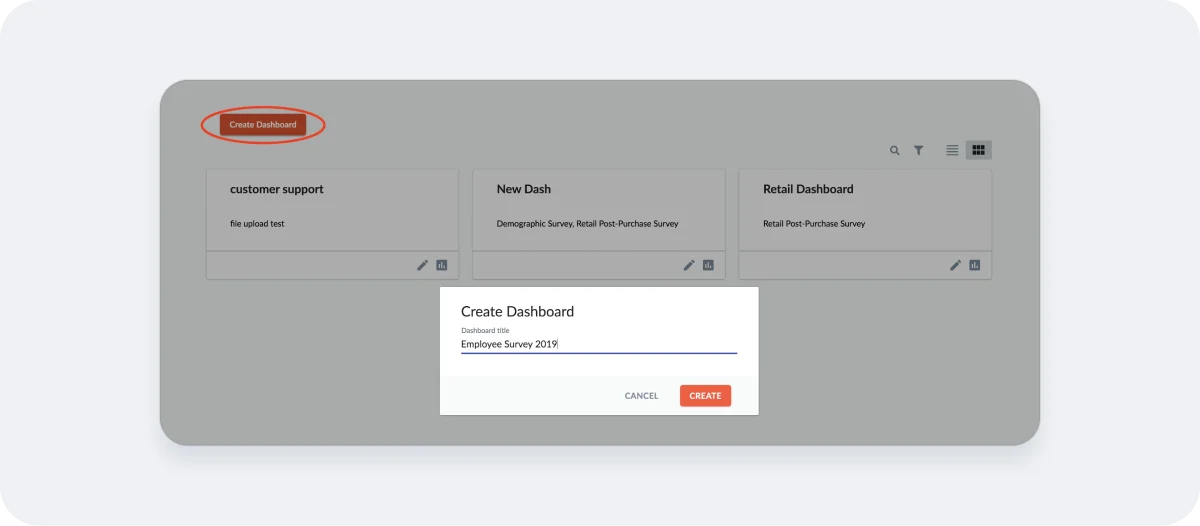
2. Create Dashboard
Click "Create Dashboard" and give it a name. The name can be the name of the survey or something else – whatever will help you identify it.
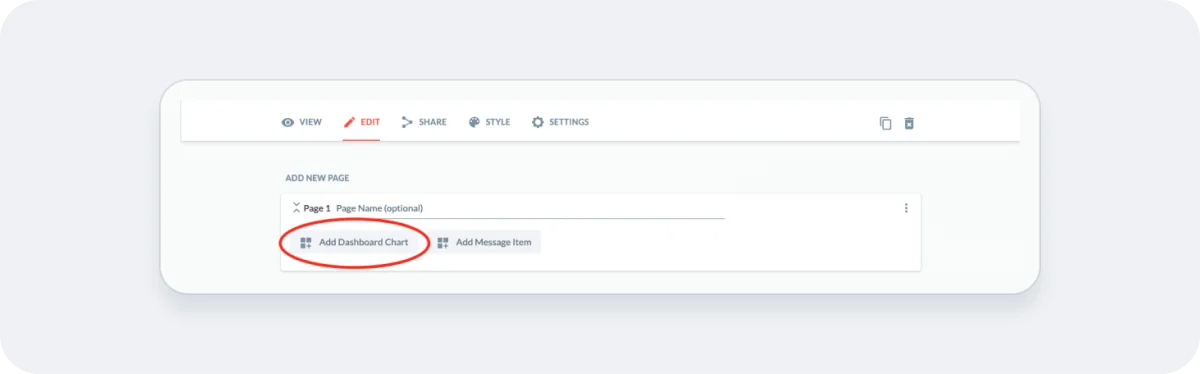
3. Add a Chart
Click "Add Dashboard Chart" to start building your Dashboard.
4. Configure the Chart
Choose the options for your Chart:
- Give your chart a name. This is optional and will be shown in addition to the survey name/question text.
- Choose the Source, which will be the Survey Name and Survey question. (*Hint: if you start typing the name of your survey under Property, it will autofill.)
- Choose the chart type, e.g. bar, column, line. Note that only the charts that are compatible with your chosen source question will be displayed.
- Add an optional Filter if you’d like to report on a subset of your data, such as responses collected in a certain date range. See our Filters Guide for more info.
- Choose your Chart Size. Small charts take up 1/3 the page width, Medium 2/3 the page width, and Large the full page width.
- Select options such as Show legend and Show “Other” options to customize your chart.
5. Finalize the Dashboard
Continue adding pages and Charts to your Dashboard until it's just the way you want it.
Note that Dashboards are yours to customize – you can include as few or as many pages and charts as you want. You can also include charts for one survey or several. Dashboards can be modified at any time.
Dashboard Settings
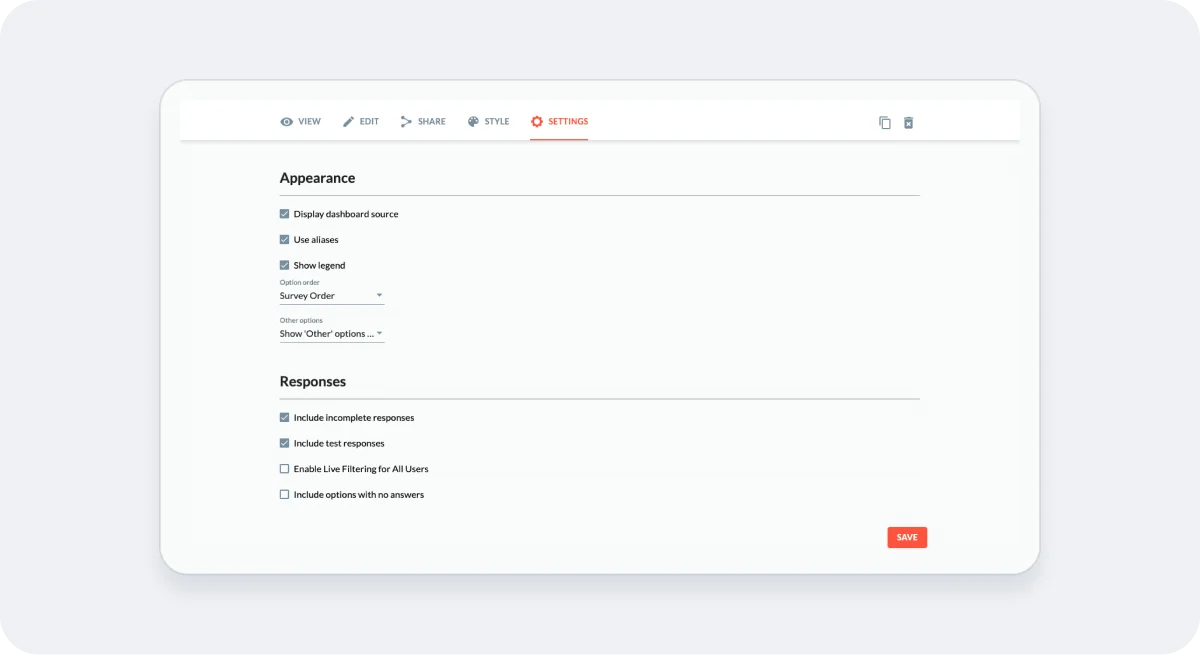
Your Dashboard includes several settings that you can enable/disable:
- Display dashboard source: This setting allows you to display the survey name and question for each chart above the chart title.
- Use aliases: This setting will cause your report to display alias text if you have specified alias values for your survey’s questions and answers. For more information on this feature, see our Alias guide.
- Show legend: This setting will show or hide chart legends for all applicable charts.
- Option Order: You can choose how to display the order of your answer options in your charts – in the order they appear in your survey (default), in descending order based on the number of responses for each option, or in alphabetical order.
- Other Options: Let’s you choose if and how to display open-ended answers to questions that have an other/please specify option. You can show “other” text answers in the chart, as a table below the chart, or in both places.
- Include incomplete responses: Choose to include both completed and partial responses in your report results.
- Include test responses: Choose to include both test and non-test responses in your report results.
- Enable Live Filtering for all users: Choose to display the Live Filter icons when you share your Dashboard with other users. This will allow them to filter your Dashboard to view subsets of the data. If you don’t want other users to be able to drill down into your results, leave this option unchecked.
- Include options with no answers: Display the options with zero responses in your chart legend.
Sharing a Dashboard
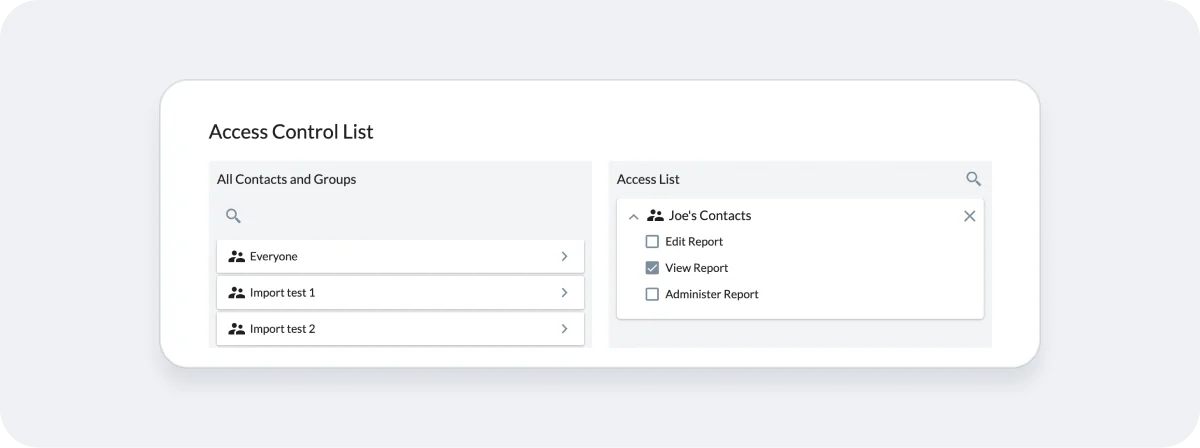
If you go to the Share tab for your Dashboard, you will see a link that can be copied and pasted in order to share your report with other users. In order for someone to access the Dashboard, either a) the link has to be publicly accessible or b) the user must be logged in to Checkbox and be on the “Access List” for the Dashboard. Click the Report Permissions button to enable either of these sharing options.
To make your Dashboard public, meaning anyone you share the link with (or that they subsequently forward the link to) will be able to view the report, click the Report Permissions button and then select “View Report” under Default Policy.
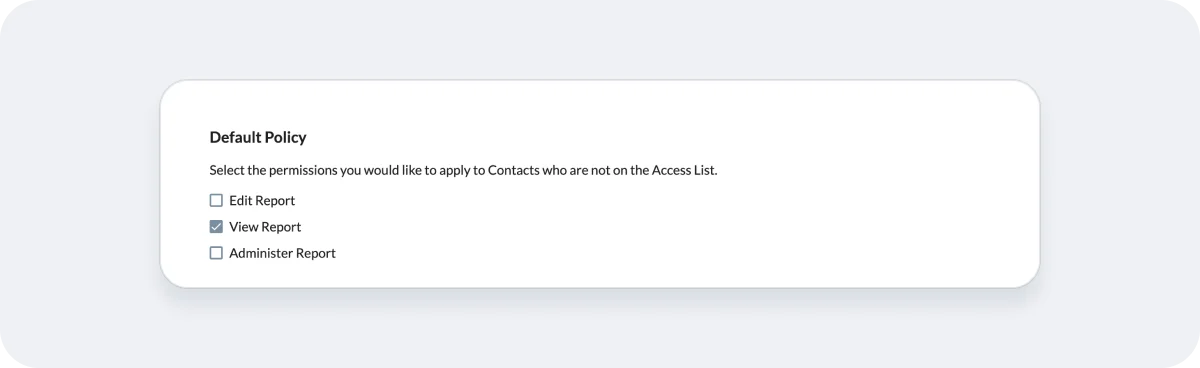
To share your Report with only certain users, click the Report Permissions button and then add your Contacts or Groups to the Access list. Depending on the options you select, you can choose to give your Contacts/Groups access to view, edit, and/or fully manage your report. Note that Contacts on the Access List will need to log into Checkbox when they click the report link.